The representative weather data

In the simplest terms, if the data can answer the question, it is representative. Ramsey and Hewitt, 2005
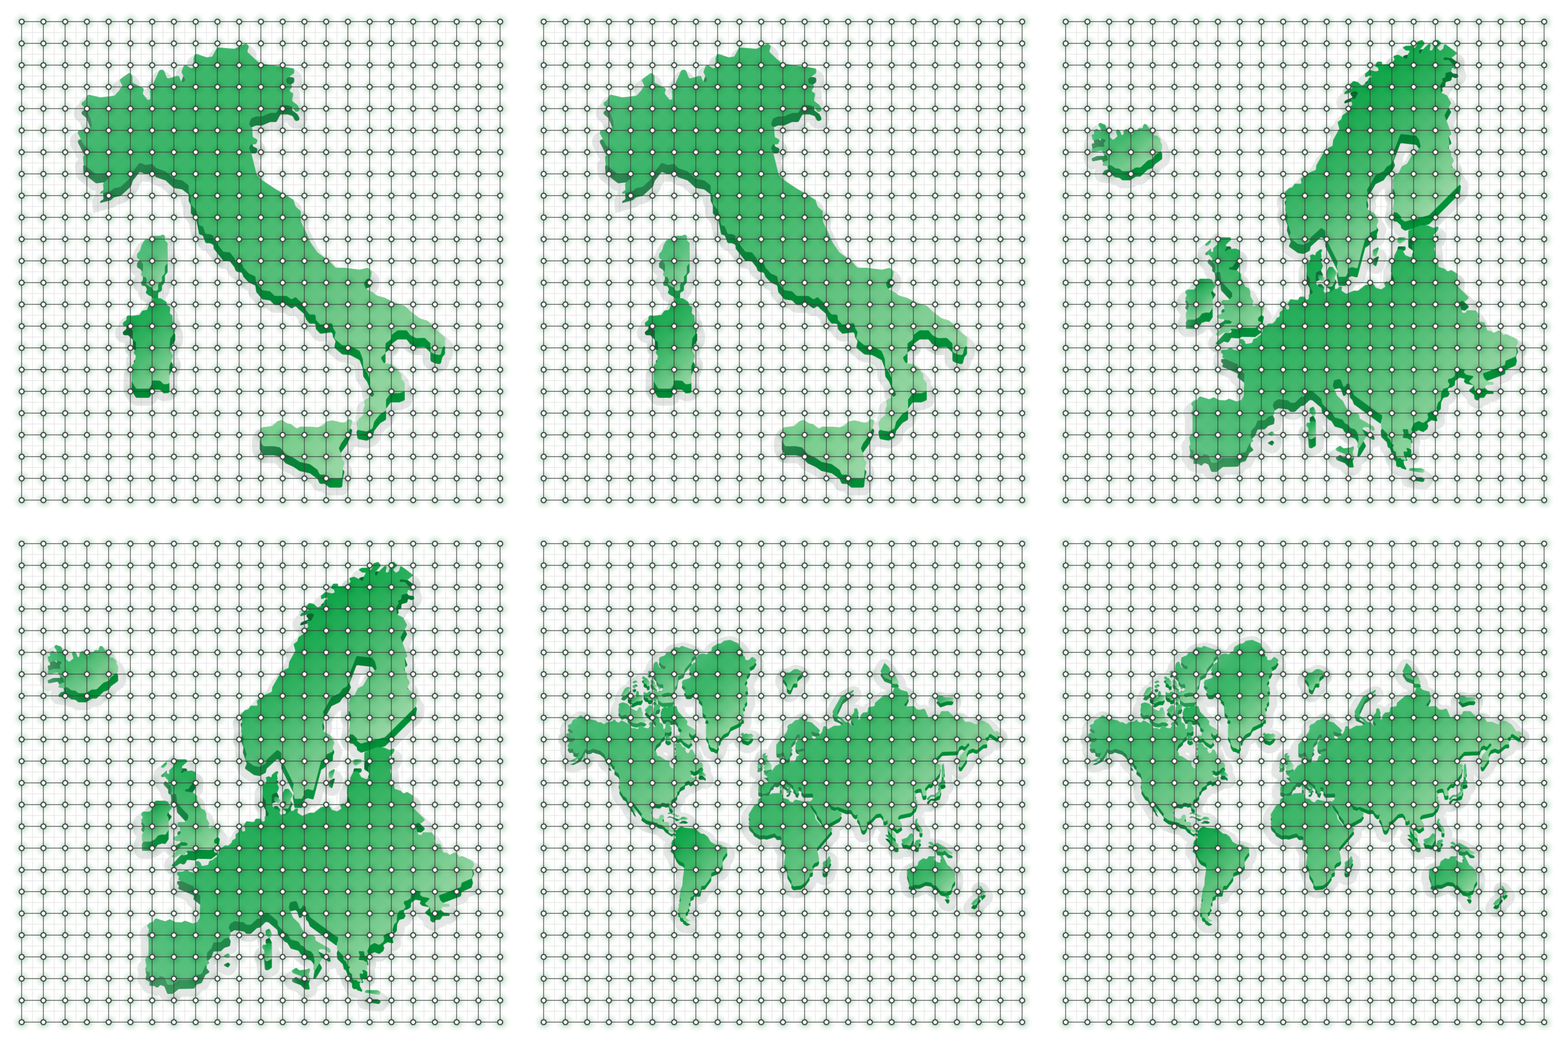
Hypermeteo has identified the 1 sq km pixel as its smallest meteorologically representative pixel, conventionally using such matrix to spatialise data across cartographic surfaces. This minimum unit indicates, on the one hand, the limit below which representativeness would lose not only numerical consistency but also credibility, and, on the other hand, it establishes the ability to have a high-resolution climate analysis capable of responding to the digital needs of representing weather events. Representative meteorological data is not immediately acquired, but is the result of a complex process. In this process, the supporting technologies and the specific requirements of the function it is intended to fulfil must find a balance.

The observational set

Hypermeteo globally collects and archives in a unified database the meteorological data originating from an observation set of 11,000 sensors, from on site meteorological networks, radars, satellites, radiosondes, lightning sensors, buoys as well as any other conventional and non-conventional instrumentation. These are both public and private official or compliant meteorological monitoring systems, in accordance with the guidelines of the World Meteorological Organization (WMO). A shared meteorological approach open to communities and citizens. It is now a strategic detection system for monitoring climate change and a reference in the decision-making processes of organisations and businesses and in meteorological risk analysis.

Processing techniques

The infrastructure of datasets and digital meteorological grids on which Hypermeteo is based is the result of a complex and diversified set of processing techniques. Hypermeteo’s datasets cover the entire time spectrum, from the past to the future, so specific weather data processing techniques must be adopted to achieve a high degree of representativeness and spatial-temporal detail.

Meteorological re-analysis and spatialization

The meteorological reanalysis method (or retrospective analysis) is the most advanced scientific technique for reconstructing past data. By combining numerical atmospheric simulation models with data assimilation systems used in forecasting, homogeneous datasets describing the past states of the atmosphere over a given area are produced.

Reanalysis incorporates data from different sources of measurement systems and integrates it into a digital meteorological grid. This grid uses spatialisation algorithms to reconstruct the state of the atmosphere in terms of its forecast variables at a certain point in time and in a continuous fashion over the area.

Learn more

Nowcasting

The nowcasting methodology is used to produce very short-term forecasts (0 to 3 hours). It is characterised by the extensive integration of the latest data collected by the monitoring networks (on site and remote), into forecasting models formulated frequently, in order to obtain forecasts that are always up to date and consistent with the latest observations.

Nowcasting guarantees adequate coverage of the spatial-temporal window for which the forecast analysis is carried out. It is used for very short-term forecasting of rainfall and of those meteorological parameters (such as temperature, cloud cover, wind speed and direction, and solar radiation) that are significant for organisations managing the feed-in of energy from renewable energy plants.

Learn more

Multimodel ensemble predictions

A multimodel ensemble forecasting approach is used to process forecast data. An ensemble of deterministic models, each of which provides a forecast scenario that is statistically reprocessed to obtain a probabilistic synthesis of future trends in meteorological variables. The system is based on models developed directly by Hypermeteo, integrated by means of algorithms with forecast data processed by official Italian and international computing centres, in order to refine the expected estimate of weather variables. The meteorological forecast data obtained is further processed using post-production techniques to significantly reduce the gap between the “simulated world” and the “real world”.

Postprocessing & Neural Networks

A set of techniques used to increase the degree of representativeness of meteorological data. In this context, machine learning procedures such as neural networks are used. These, by assimilating data together with auxiliary co-variables, make it possible to significantly reduce the uncertainty of the final datasets. In the field of forecasting, in particular when it is necessary to make forecast data comparable with historical data from a single location (e.g. weather station), the Model Output Statistics (MOS) technique is used to reduce the biases typical of modelling outputs.

Quality control and data validation

A set of procedures used to assess the quality of the data acquired by the observational networks included in the Unified National Database (data from remote sensing and on-site stations) and the output datasets resulting from Hypermeteo’s processing chain. Automatic and manual quality checks prevent unreliable data and on-site or radar measurement errors from entering the database. The datasets are analysed by means of a range test together with a statistical-climatological analysis capable of identifying any values that do not correspond to the typical climatology of the area.

Virtual domains, grids and stations

Every weather analysis process generates spatialised datasets on grids that form the digital twin of the various geographical areas of the planet. Each cell of this digital grid corresponds to a continuous flow of meteorological data, whether historical, near real-time, nowcasting, or forecasting. It is possible to associate every location on the earth’s surface with a grid point representing its weather and climate conditions, with a maximum spatial resolution of 1 sq km.

Hypermeteo’s customers